Grupo FAMSA's growth is based on its main strengths:
Solid market position in Retail Sector in Mexico.
Advanced information systems and technology created to measure.
Highly expandable and flexible business platform.
Experienced management team with extensive technical capacity.
Extensive experience in retail sales and consumer financing.
Highly trained and motivated human resources.
The commitment and dedication of Grupo FAMSA has been and will continue to be the delivery of products and services of the highest quality, in competitive conditions, through an efficient and profitable execution.
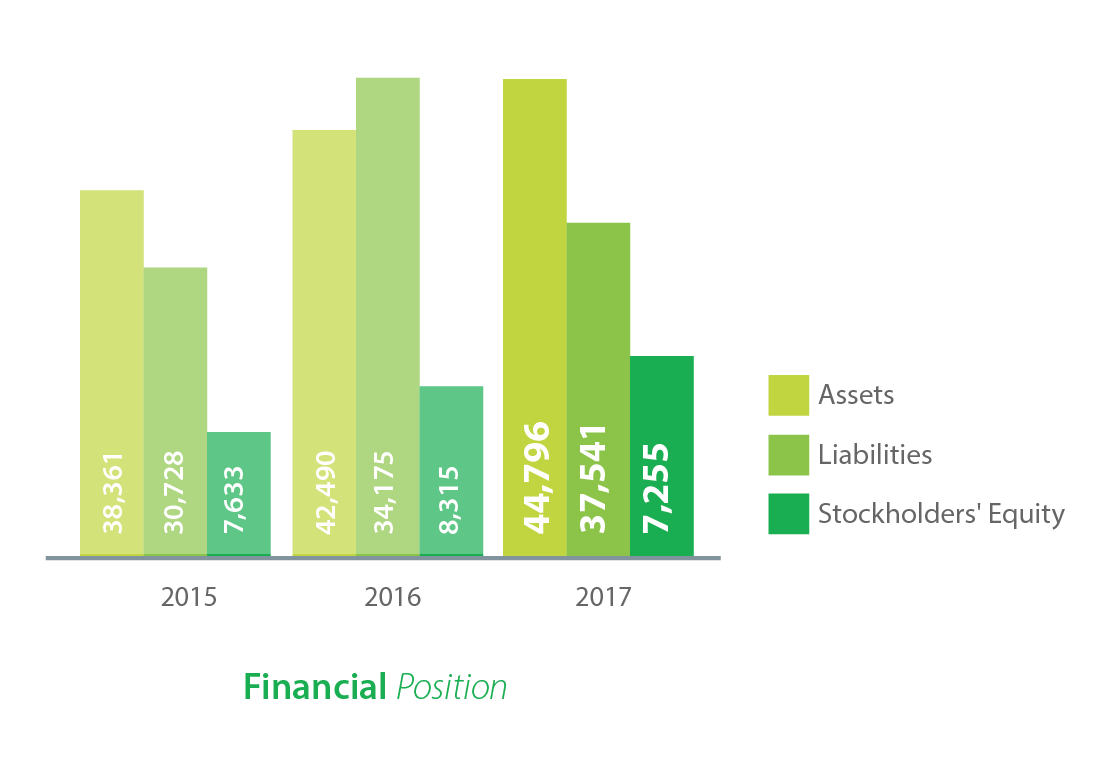
Financial Position
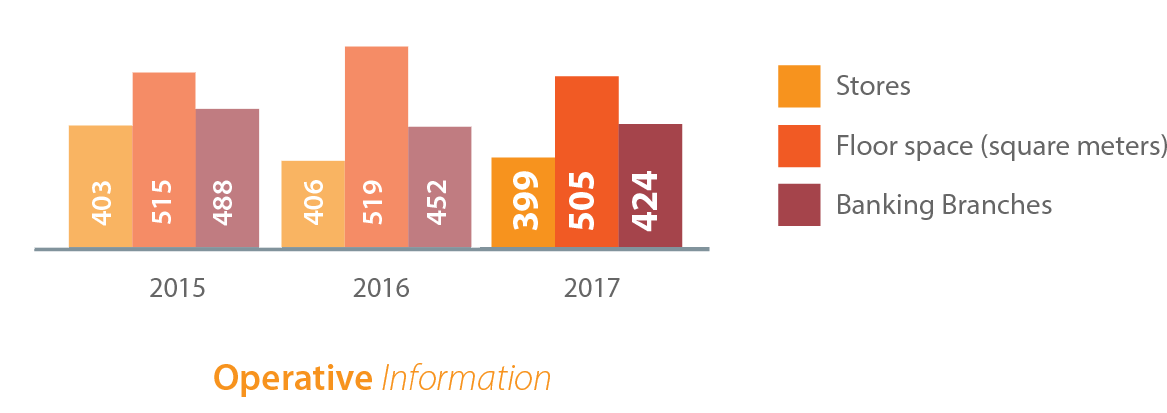
Operative Information
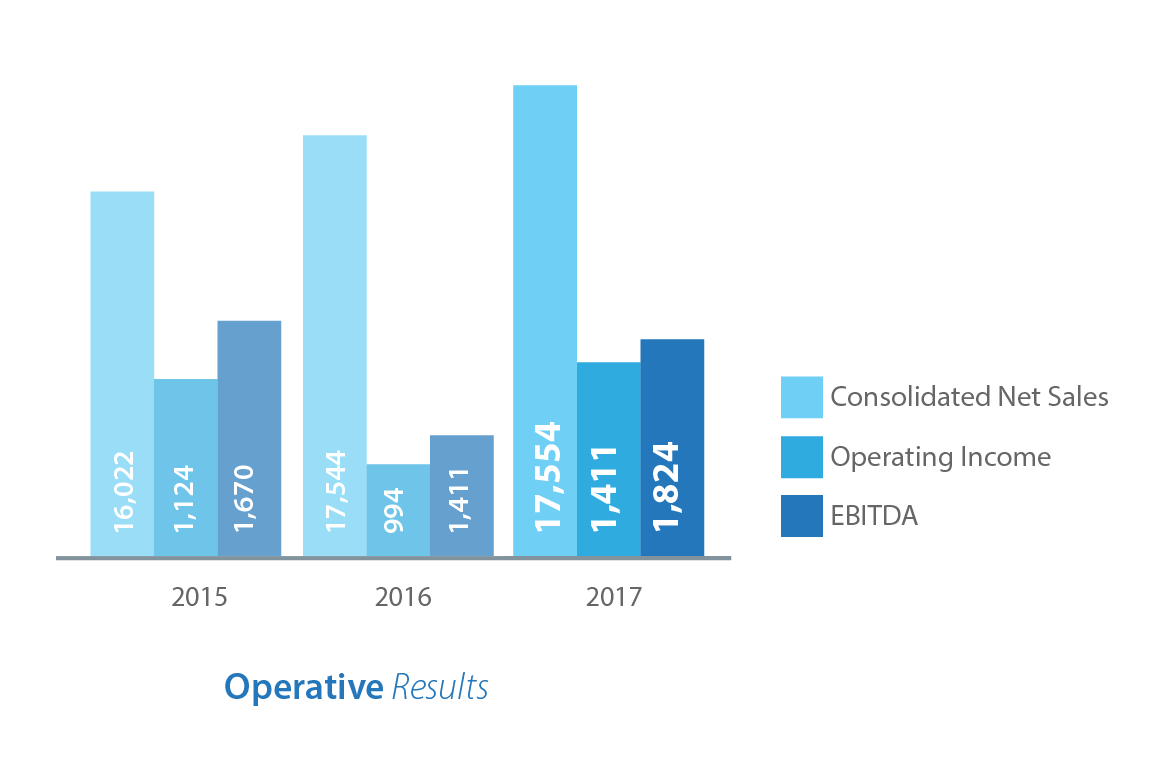
Operative Results
Grupo Famsa, S.A.B. and Subsidiaries
Financial Position
2017
2016
2015
Variation
Assets
$44,796
$42,490
$38,361
10.8%
Liabilities
$37,541
$34,175
$30,728
11.2%
Stockholders' Equity
$7,255
$8,315
$7,633
8.9%
Grupo Famsa, S.A.B. and Subsidiaries
Operative Information
2017
2016
2015
Variation
Total Stores
399
406
403
-1.7%
Mexico
377
380
377
-0.8%
United States
22
26
26
-15.4%
PL USA Branches
26
28
28
-7.1%
Banco Famsa
424
452
488
-6.2%
Banking Branches
391
399
400
-2.0%
Assets
33
53
88
-37.7%
Active Accounts (Millions)
1.2
1.2
1.2
0.0%
Employees
19,380
17,667
19,117
9.7%
Mexico
18,857
17,039
18,396
10.7%
United States
523
628
721
-16.7%
Grupo Famsa, S.A.B. and Subsidiaries
Operative Results
2017
2016
2015
Variation
Net Sales
$17,554
$17,544
$16,022
0.1%
Mexico
$15,605
$15,157
$13,884
3.0%
Unites States
$1,843
$2,265
$2,027
-18.6%
Others
$1,030
$1,020
$941
1.0%
Intersegments
-$912
-$898
-$830
1.6%
Gross Profit
$7,904
$7,819
$7,055
1.1%
EBITDA
$1,824
$1,411
$1,670
29.3%
Operating Income
$1,411
$994
$1,124
41.9%
Net Income
$307
$346
$149
-11.3%
Gross Margin
45.0%
44.6%
44.0%
EBITDA Margin
10.4%
8.0%
10.4%
Net Margin
1.7%
2.0%
0.9%